lunes, 25 de diciembre de 2017

Semana 72 / Week 72 ( Dec, 22 expiration date )

Semana muy complicada que conseguimos salvar gracias a la holgura que siempre le damos al stop loss. Siempre fijamos el stop loss en el doble de la prima ingresada, y el combo aunque llegó a valer 10,80$ en ningun momento alcanzó los 12 $ que teniamos de stop loss . No obstante, nuestra posición se metió "en el dinero"; esto ocurre cuando alguno de los strikes vendidos en nuestro combo ( en este caso la call vendida en 1.555) son tocados por el valor del subyacente. En ese punto el valor intrinseco de la citada call pasa a ser 0 , aunque siempre queda algo de valor temporal.

Lo cierto es que estamos en un momento dificil para la venta sistemática de opciones. Podemos ver en el siguiente gráfico una representación en gráfico renko ( mi favorito, porque marca muy bien soportes y resistencias ) de la evolución del RVX ( volatilidad del Russell 2000 ). Cada caja representa una variación de un punto en la volatilidad, es por tanto un gráfico atemporal. Aunque esta estructura lateral alcista favorece nuestra estrategia, al no moverse el precio, cada vez es mas dificil ingresar prima, al margen de la constante amenaza de un movimiento brusco del mercado, que iria contra nuestros intereses, al ser vendedores de volatilidad.

Esta semana no he operado, aunque hubiera sido muy favorable, dado que el mercado no se ha movido. Aprovecho para felicitar la navidad a todo el que la sienta de corazón.

--------------------------------------------------------------------------------

Very complicated week that we managed to save thanks to a big margin we always give the stop loss. We always set the stop loss at twice the premium cashed, and the combo, although it came to be worth $ 10.80, at no time reached the $ 12 ( our stop loss). However, our position got "in the money"; This occurs when one of the strikes sold in our combo (in this case the call sold at 1.555) is touched by the value of the underlying. At that point the intrinsic value of the mentioned call becomes 0, although there is always some temporary value. The truth is that we are involved into a difficult time for a systematic sale of options. We can see in the following graph a representation in renko chart (my favorite, because it marks very well supports and resistances) of the evolution of the RVX (volatility of the Russell 2000 Index). Each box represents a variation of one point in the volatility, it is therefore a timeless graphic. Although this bullish lateral structure favors our strategy, as the price does not move, it is increasingly difficult to cash a reasonable premium, apart from the constant threat of a sudden movement of the market, which would go against our interests, being volatility sellers. This week I have not traded, although it would have been a very favorable week, considering the market has not moved. I take this opportunity to congratulate next Christmas to everyone who feels it from the heart.

RVX evolution chart in renko style ( box=1 point)


Weekly performance and main Stats


Index chart and sold strikes. Entry and exit points


Track record since 2016 September...suffering a drawdown


viernes, 1 de diciembre de 2017

Semana 71 / Week 71 ( Dec, 8 expiration date )

Tuvo que llegar ese dia que nunca que queremos , y lamentablemente llego, visto y no visto, una vela demoledora que en 30 minutos hizo bajar el Russell mas de un 3% , y subir la volatilidad casi un 5%. Lo teniamos todos a favor, rango de 65 puntos y una prima excelente superior  a 8 dólares.
Ya sabemos que el principal enemigo de la venta de opciones es un movimiento brusco del mercado , y peor si es hacia abajo pues hara subir la volatilidad bruscamente cuando nosotros vamos corto de Vega. En momentos dificiles como este, con el sistema en maximo drawdown , nos entran unas ganas terribles de subir contratos para compensar, tras dos semanas malas seguidas. Pues bien siguiendo nuestra hoja de ruta vamos a hacer justo lo contrario y bajar a 3 contratos para el próximo trade.
Seamos pacientes , disciplinados y sobre todo luchadores.

-------------------------------------------------------------------------------


That day we never want, had to arrive and unfortunately It came up, seen and not seen...., a demolishing candle that just in less than 30 minutes made the Russell drop more than 3%, and raised the volatility almost a 5%. We had it all in favor, a range of 65 points and an excellent premium above 8 dollars.
We already know that the main enemy of selling options is a sudden movement of the market, and worse if it is downwards because it will raise the volatility sharply considering out position is short of Vega. In difficult times like this, with the system in maximum drawdown, a deep desire to raise contracts growths inside us to compensate losses, after two bad weeks in a row. Well.... following our roadmap, we will do just the opposite and go down to 3 contracts for the next trade. Let's be patient, disciplined and above all fighters.
Weekly set up and final permormance
Russell chart with entry and exit points
Track record and money management rules

miércoles, 22 de noviembre de 2017

Semana 70 / Week 70 ( Nov, 24 expiration date )

Si lo reconozco , esta vez me he equivocado ! Buscar un equilibrio entre la disciplina y la flexibilidad es lo mas dificil que hay en el trading. Como he explicado en otras entradas las operaciones se abren los jueves y se cierran los martes de la semana del vencimiento , salvo que antes alcancemos un 60%-65% de la prima ingresada antes del martes (fecha límite para cerrar).

Veamos la situación el lunes pasado a las 19:00 h ( GTM+1)


El Lunes a media tarde estabamos en un punto de clara comodidad, el 50% de la prima ingresada en nuestro bolsillo ( 1.150$ / 2.300$ ) , y el mercado tranquilo aunque relativamente cerca de nuestro call strike vendido en 1.510 puntos. Mi error ha sido no adaptarme a la pauta estacional de la semana del dia de acción de gracias + black friday , tradicionalmente alcista. Los americanos nunca dejan caer el mercado  en estos dias, y estando mi posición descentrada y cercana al strike vendido por arriba, debi cerrar en lugar de buscar unos cuantos dólares mas el martes. El movimiento brusco de la pre apertura del mercado el martes ya me hacía ver que me había equivocado. LLevaba dos semanas sin operar para evitar el dato de paro mensual , y porque tengo que reconocer que llevo bastante miedo en el cuerpo, la racha ganadora es demasiado buena. 

En fin, bajamos nuevamente de 5 a 4 contratos ( los 5 se estan resistiendo ) , y esperaremos una semana mas fructífera.

-------------------------------------------------------------------------------------------------------


Yes....I recognize it, this time I was wrong! Looking for a balance between discipline and flexibility is the most difficult thing in trading. As I explained in other entries, we usually open our trades on Thursdays and close on Tuesdays, unless we previously reached 60% - 65% of the premium cashed before Tuesday (deadline to close).
Let's see the situation last Monday at 7:00 PM (GTM + 1)


On Monday afternoon we reached a point of certain comfort, 50% of the premium cashed in our pocket ($ 1,150 / $ 2,300), and a quiet market but relatively close to our call strike sold at 1,510 points. My mistake has been not to adapt my strategy to the seasonal pattern that usually happens at the thanksgiving day+black Friday week, traditionally bullish. Americans never let the market drop these days, and with my position not centered, and pointing dangerously towards my strike sold at the top, I should have closed my position instead of looking for a few more dollars on Tuesday. The sudden movement during the pre-opening market on Tuesday, was announcing I had made a mistake. I have to admit I am a little bit scared lately, the winning streak is too good.
Anyway, we go down again from 5 to 4 contracts for the next week.( 5 contracts series are resisting), and we will look forward to a better week.

Weekly set up and performance


Final Index chart, with entry and exit points. Sold strikes plotted


Money management template and historical track record


martes, 31 de octubre de 2017

Semana 69 / Week 69 ( Nov, 3 expiration date )

Puede parecer arriesgadisimo abrir un rango de solo 40 puntos, con las alas a solo 20 puntos del precio de apertura , pero nosotros tradeamos las matematicas. Nos basamos en el precio , el tiempo que resta al vencimiento y la volatilidad histórica. Esperemos que el precio se mueva dentro una desviación standard en una distribución normal , y con una probabilidad de exito a vencimiento de un 68% , que sube por encima del 85% gracias a la cancelación anticipada de la posición.

Y eso es lo que se hace las semanas que se opera, una y otra vez. No se piensa, si  el rango es mucho o poco, siempre buscamos 1 desviación standard. Nuestro objetivo debe situarse entre el 60% y 70% de la prima ingresada y nunca perder mas del 100% de la prima ingresada ( el doble ).

Nos da igual si el mercado esta sobrecomprado, o sobrevendido , o si hay una determinada recomendación. Se acuerdan cuando Goldman Sachs pronosticaba hace meses un eurodolar a 0,90 ?
Disciplina y paciencia. No hay mas. Por cierto , semana fantastica y nuevo pico en la curva de beneficios.

---------------------------------------------------------------------------------

It may seem risky to open a range of only 40 points, with the wings only 20 points from the opening price, but we trade the mathematics. We rely on the price, the time remaining at maturity and the historical volatility. We expect that the price moves within one standard deviation in a normal distribution, and with a probability of success at expiration of 68%, which rises above 85% thanks to the early cancellation of the position.

And that's what you do the week we trade, over and over again. Do not think, if the range is too much or too little, we always look for 1 standard deviation. Our target must be between 60% and 70% of the premium paid and never lose more than 100% of the premium paid (double).

We do not care if the market is overbought, or oversold, or if there is a certain recommendation. Do you remember when Goldman Sachs predicted Eurodolar at 0.90 months ago?
Discipline and patience. That`s all. By the way, fantastic week and new peak in tour equity line.


Weekly set up and final performance


Index Chart , sold strikes , and entry and exit points (Future)


Money Management template and track record with main Stats


martes, 17 de octubre de 2017

Semana 68 / Week 68 ( Oct, 20 expiration date )

Volvemos a beneficios tras bajar de 5 a 4 contratos , siguiendo nuestra hoja de money management con una estricta disciplina . El mercado no se movio........... que quiere decir esto ? Dinero a nuestro bolsillo.

---------------------------------------------------------------------------------

We return to profits after decreasing from 5 to 4 contracts, following our money management sheet with strict discipline. The market did not move ........... what does this mean? Money in our pocket.

Weekly setup and performance


Weekly range and index chart


Money management sheet


lunes, 2 de octubre de 2017

Semana 67 / Week 67 ( Oct, 6 expiration date ) Year Summary Metrics

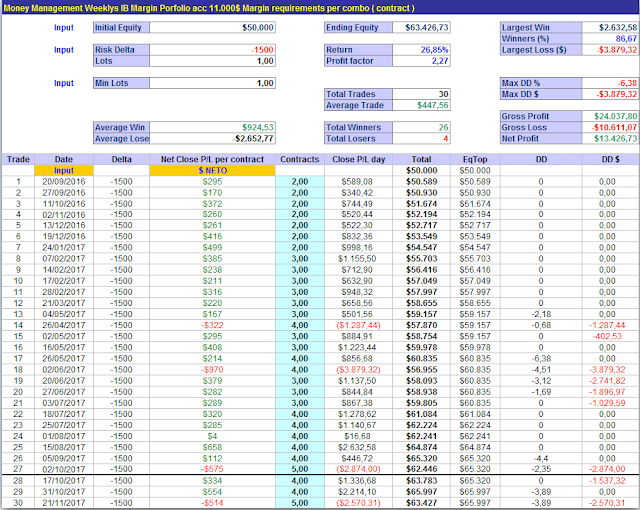
Semana claramente mala, ante un mercado imparable. Hoy Lunes por la noche hemos tocado el strike call vendido y superado el doble de la prima ingresada. Cumplimos un primer año con buenos numeros:

Rentabilidad final : 12.446$  (24,89%)
Drawdown máximo: 3.879$ (-6,38%)
Semanas operadas: 27 de 52
Porcentaje operaciones ganadoras: 88,89%
Semanas ganadoras: 24
Semanas perdedoras: 3
Profit Factor= 2,55

---------------------------------------------------------------------------------

Losing week, facing a very strong market. Today Monday night, we reached the sold call strike and exceeded twice the cashed premium . We fulfilled a first year with good metrics: Final profit: $ 12,446 (24.89%) Maximum Drawdown: $ 3,879 (-6.38%) Weeks traded: 27 of 52 Percentage of winning trades: 88.89% Winning weeks: 24 Lossing Weeks: 3 Profit Factor = 2.55

Weekly performance and set up


Russell Index chart ( future)


Money management template and track record


martes, 5 de septiembre de 2017

Semana 66 / Week 66 (Sep, 8 expiration date)

Semana algo arriesgada ya que hubo que abrir un rango muy estrecho (1385-1425) para poder obtener algo de prima, dado el bajo nivel de volatilidad. Una pena, el incremento de volatilidad a media tarde del martes, justo antes de cerrar la posición, pues erosionó algo el resultado.
Próxima entrada subimos a 5 contratos por money management.

---------------------------------------------------------------------------------

This was a risky week, since a very narrow range had to be opened (1385-1425) in order to obtain some premium, considering the current low level of volatility. A shame, an unexpected increase in volatility mid-afternoon on Tuesday, just before closing the position, because it eroded somewhat the result.
Next entry we raised from 4 to 5 contracts considering our money management rules.

Set up and Weekly performance


Chart with entry and exit points in Russell index ( future)


Track record and money management template


martes, 15 de agosto de 2017

Semana 65 / Week 65 ( Aug , 18 expiration date )

A pesar de las dudas que habia en el mercado, la tensión con Corea , hemos cerrado la mejor semana de toda la serie histórica; gracias al incremento de volatilidad cercano al 40% , que hubo en los dias previos a la apertura del trade. El rango 1355-1405 podia parecer algo estrecho, pero es lo que nos marcaba 1 desviación estandar; considerando el precio del subyacente, numero de dias a vencimiento y el nivel de volatilidad histórica del momento. Esto nos supuso un ingreso de  10$ de prima por contrato , muy por encima de la media de los ultimos meses. Simplemente fantastico , y a mes y medio de cerrar el año ya tenemos un 30% de rentabilidad ; con mínima exposición al mercado. No hay trucos , solo mucho disciplina.

------------------------------------------------------------------------------------

Despite several doubts in the market, the tension with Korea, We closed the best week of the whole historical series; thanks to a volatility increase next to 40%, which occurred just a couple of days before opening the trade. The 1355-1405 range may seem somewhat narrow, but It is simply the value of one standard deviation; considering the price of the underlying, number of days to maturity and the level of historical volatility at the moment. This gave us a $10 premium income per contract, above the average of the last months. Just fantastic, and a month and a half ahead to close this first year We already reached a 30% profitability; with minimal exposure to the market. No tricks, but so much discipline.


Weekly performance and main Stats


Rusell 2000 main chart and trade evolution


Money management template and track record


miércoles, 2 de agosto de 2017

Semana 64 / Week 64 ( Aug, 4 expiration date )

Semana muy dificil que cerramos con un beneficio minimo.  Nada mas abrir el rango 1420-1470 el jueves, el mercado bajó bruscamente casi un 2% , y el precio se paró todo el viernes, al limite de saltar el stop loss, incluso llegó a tocar el put strike vendido, pero la volatilidad no apenas se movió el viernes y eso nos salvó. Cerré el martes nada mas abrir el mercado porque a pesar de que el indice empezó a subir , tambien lo hizo la volatilidad, lo cual no es frecuente, y va contra nuestra posición al ir cortos de volatilidad.. Mejor esperar a otra semana.
---------------------------------------------------------------------------------
Very difficult week that we closed with a minimum profit. As soon as the 1420-1470 range was opened on Thursday, the market fell sharply by almost 2%, after this,the price stopped along Friday,. Despite the put strike was touched ( position entered " at the money") , stoploss wasn't executed, because  volatility did not barely move on Friday and this situation saved us. I closed on Tuesday just a couple of minutes after opening the market; even though the index started to rise, so did the volatility, which is not frequent and goes against our interests (we are short on volatility ).. Better wait for another week...

Week Performace and main set up


Chart analysis over Russell 2000 Future ( not index)


Track record and money management template


martes, 25 de julio de 2017

Semana 63 / Week 63 ( July, 28 expiration date)

Nueva semana ganadora, donde el rango 1415-1465 funcionó perefectamente ( 1 desviación standard sobre el valor del indice ). Seguimos con la volatilidad en los niveles mas bajos de los últimos 25 años , y nosotros mejorando nuestra curva de beneficios. Atencion al mes de agosto donde podría venir un incremento importante de la misma.

---------------------------------------------------------------------------------

New winning week, where the rank 1415-1465 worked perfectly (1 standard deviation on index value). We continue with volatility at the lowest level of the last 25 years, and despite this we keep on improving our equity line. Let's pay attention to the month of August where it could come up a significant increase of the volatility value.


Weekly Setup and performance.


Track record and money management template.


miércoles, 19 de julio de 2017

Semana 62 / Week 62 ( July, 22 expiration date )

Nueva entrada exitosa, y hacemos un nuevo maximo en nuestra equity line a pesar del susto de primeros de Junio. Con esta estrategia es de vital importancia ser disciplinado , paciente , y estar seguro de lo que hacemos. El mercado se lateraliza mucho cuando parece que viene un movimiento desvastador , la formula del éxito es la disciplina pues la estrategia es muy sencilla. Siempre debemos ser escrictos con nuestro plan de trading.

-------------------------------------------------------------------------------

New successful entry, and make a new maximum in our equity line despite a scary early June. With this strategy it is vitally important to be disciplined, patient, and be sure of what we do. Most of the times the market usually turns choppy when It seems that a devastating movement is coming, the formula of success is the discipline because the strategy is very simple. We always must be stricted with our trading plan.

Weekly performance and orders setup


Track record and money template


lunes, 3 de julio de 2017

Semana 61 / Week 61 ( July, 7 expiration date)

Semana mas corta de lo habitual al ser mañana festivo, seguimos subiendo y aumentamos a 4 contratos para el próximo trade. Esperamos que en esta ocasión podamos hacer un nuevo máximo histórico.
---------------------------------------------------------------

Week shorter than usual considering tomorrow is the Independence day. We continue improving our track record and will increase up to 4 contracts for the next trade. We hope this time we can make a new historical high.


Week performance and set up


Russell Index and Volatility chart with entry and exit points


Track record and money management template


sábado, 1 de julio de 2017

Semana 60 / Week 60 ( June, 30 expiration date )

Semana tranquila, con poco movimiento en la volatilidad, y continuamos en plena recuperación. Esta semana ya hemos abierto un nuevo trade el Jueves 29 en el nivel 1385-1445 ; aunque lo cerraremos el Lunes en lugar del Martes, que es festivo en USA, día de la independencia.

---------------------------------------------------------------------------------

Quiet week, inmerse in our friendly choppy market, and still recovering some losses from the beggining of the month. This week we have already opened a new trade on Thursday 29 at level 1385-1445 ; although we will close it on Monday instead of Tuesday, considering Tuesday is holiday in USA, Independence day.

Week Performance


Russell Index and Volatility chart with entry and exit points


Track record and money management template


martes, 20 de junio de 2017

Semana 59 / Week 59 (June, 23 expiration date )

Tras el dato del paro mensual, que nos provoco una fuerte perdida, volvemos a la carga, semana limpia y acercándonos a máximos. Mercado claramente lateral - alcista.

---------------------------------------------------------------------------------

After the monthly unemployment data, which caused us a strong loss, we return to the job, quiet week and approaching a new high. Market clearly lateral - bullish.


Weekly set up and final performance


Entry and exit Points , Index and volatility chart


Money management template and track record


viernes, 2 de junio de 2017

Semana 58 / Week 58 ( June, 9 expiration date )

Mercado muy alcista tras dato del paro mensual, y nos destroza la weekly semanal, cerramos la posición por salto de stop loss y bajamos a 3 contratos para la próxima semana.

---------------------------------------------------------------------------------

Very bullish market after data of monthly unemployment was published, which shattered our weekly. I closed the position with a stop loss order (repurchased premium at 15$) and lowered to 3 contracts for next week.

Weekly set up


Russell 2000 index and volatility chart


Track record and money management template


viernes, 26 de mayo de 2017

Semana 57 / Week 57 ( Jun, 2 expiration date )

Semana atípica, al ser Lunes 29 de Mayo festivo en USA. Por esta razón adelantamos la apertura de la posición un día, al miercoles, si bien hemos preferido cerrar este Viernes en lugar del próximo Martes , para no estar expuesto a posibles noticias este largo fin de semana.

Seguimos en niveles ridículos de volatilidad.

---------------------------------------------------------------------------------


Atypical week, considering next Monday May 29 markets will be closed in the USA. For this reason, we anticipated the opening of the position one day, on Wednesday, although we preferred to close this Friday instead of next Tuesday, in order not to be exposed to possible news this long weekend.

We continue at ridiculous levels of volatility, inmerse in a choppy market.

Week Set up and trades


Charts and volatility peaks


Money management and template